


")


An interactive online map allows you to punch in your home address and superimpose the global geography of epochs gone by to see how the earth has changed over 750 million years.
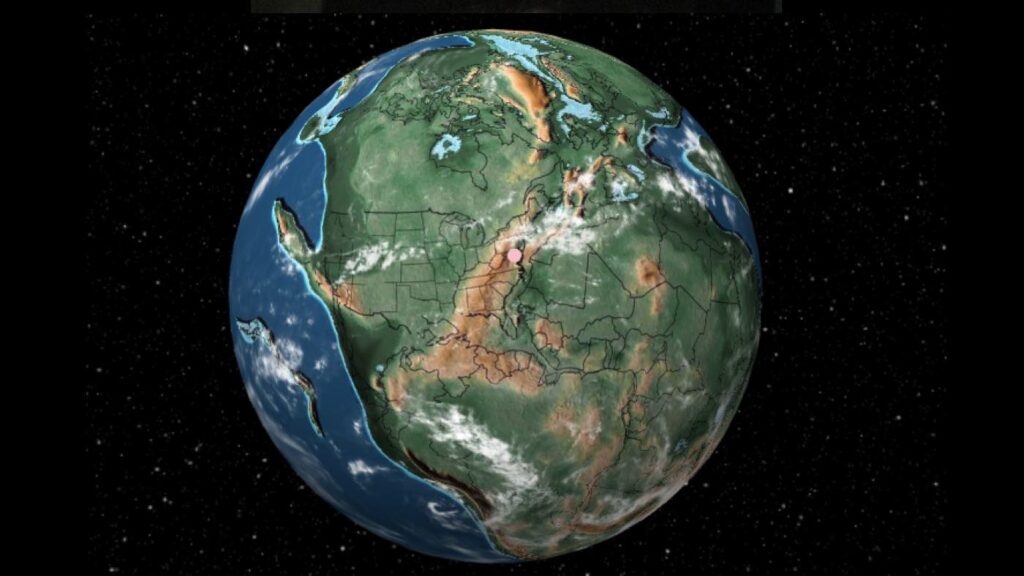
Seeing the results can be super surprising. 600 million years ago, for example, when multicellular life was just beginning to emerge in the ocean, the U.S. capital of Washington D.C. was smashed into the coast of West Africa as part of a jumbled ball of land stretching to the South Pole, which would eventually break off, drift away, and form the Americas.
The love-labor project of paleontologist Ian Webster, the exciting map tool allows users to enter most towns, cities, and countries into a search bar here, where a 3D rotatable globe will show you approximately where the land was located throughout a 750 million-year timeline.
The project is attached to the world’s largest digital dinosaur database, also created by Webster, who drew on geographical data from another resource called Ancient Earth. Created by paleographer Christopher Scotese, Ancient Earth was a culmination of work 30 years in the making called the Paleo Maps Project.
The webpage displays with a variety of tools that allow you to learn interesting information, or select a time period based on the emergence of specific features, such as the first flower to ever bloom on Earth.
Given that Webster is an expert in dinosaurs, any location you enter in the search function will also provide you with a list of dinosaurs that would have been your neighbors—all with inline links to that particular dinosaur’s profile on Webster’s database; all-in-all it represents an incredible educational resource for children and adults interested in paleontology or geography.
Paleo-perspective
Even with modern GPS technology and programs like Google Maps, globes and 2-dimensional paper maps continue to shape our perception of the sphere we call Earth.
A great example of our reliance on maps is the Chinese word for China—“Middle Kingdom.” This perception as China being the land between heaven and Earth is reflected on Chinese maps, where it is the Pacific Ocean that occupies the right-central areas instead of the Atlantic, and where Asia and Africa clog up the left side with the other continents situated to the right.
Another example can be found in maps dated in the 1980s or earlier, when given the importance of the Northern Hemisphere to most scholars, the Equator was positioned at 10 degrees north longitude, making the continents of the Southern Hemisphere appear smaller.
Ancient Earth is the ultimate in perspective-shifting educational tools—especially for kids, as they get to see their very own homes move around in the tectonic dance that’s been going on for billions of years.
“I’m amazed that geologists collected enough data to actually plot my home 750 [million] years ago, so I thought you all would enjoy it too,” Webster wrote in a comment on Hacker News.
MORE: After Decades of Work, Scientists Have Mapped the Entire Surface of the Moon for the First Time
“Obviously we will never be able to prove correctness,” Webster concludes. “In my tests I found that model results can vary significantly. I chose this particular model because it is widely cited and covers the greatest length of time.”